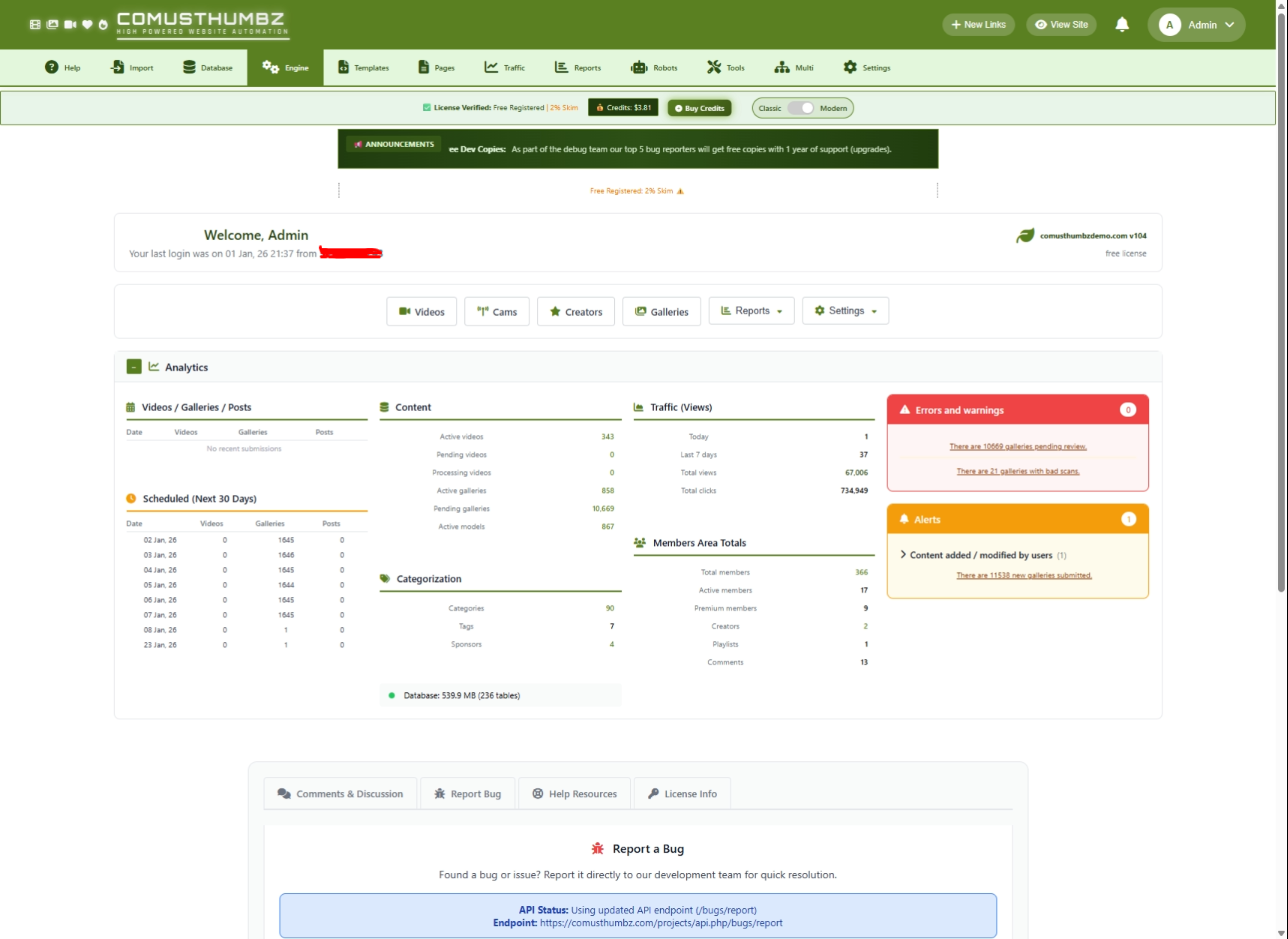
Main Dashboard
Admin Dashboard - User Guide
Page Location: ct/admin/main.php
Menu Path: Admin Panel → Dashboard (Home icon)
Access Level: Administrator (requires login)
Last Updated: 2026-01-01
Overview
The Admin Dashboard is the central control hub for ComusThumbz administrators. It provides a comprehensive overview of your site's content, traffic, members, and system health. The design features collapsible sections, multi-column analytics, real-time alerts, and quick action buttons for common administrative tasks.
Getting to This Page
- Log in to the admin panel at
ct/admin/ctlogin.php - You'll be automatically redirected to the dashboard
- Alternatively, click the Home icon in the navigation menu
The dashboard is the default landing page after successful login. It provides an at-a-glance view of your entire site.
System Requirements
This page requires the following system dependencies to function properly.
PHP Requirements
Required PHP Extensions
Folder Permissions
Server Requirements
Page Layout
The dashboard is organized into several distinct sections:
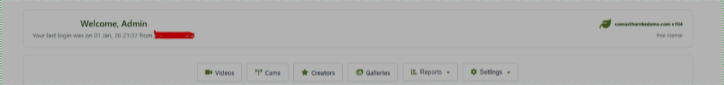
Welcome Section
Quick Actions Bar
A horizontal bar with commonly-used action buttons:
Reports Dropdown:
- Financial →
financialreports.php - Clicks →
clickstats.php - Tokens →
tokenusage.php - Content →
contentanalytics.php
Settings Dropdown:
- Videos →
videoprocessorsettings.php - General →
config.setup.php - Cams →
camssettings.php - Creators →
creatorplatformsettings.php
Analytics Section (Collapsible)
The main analytics section contains a 4-column grid: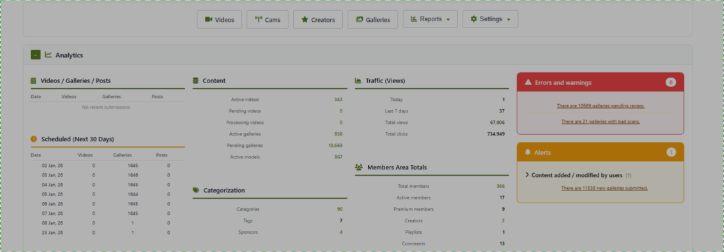
Column 1: Submissions by Date
Also includes Scheduled Content (Next 30 Days) table showing upcoming scheduled releases.
Column 2: Content & Categorization
Content Statistics:
- Active videos (linked to filter)
- Pending videos (linked to filter)
- Processing videos (linked to filter)
- Active galleries
- Pending galleries
- Active models
Categorization Statistics:
- Categories count
- Tags count
- Sponsors count
Database Health Mini-Panel:
- Status indicator (green/yellow/red dot)
- Database size in MB
- Table count
Column 3: Traffic & Members
Traffic (Views):
- Today's views
- Last 7 days views
- Total views (highlighted)
- Total clicks
Members Area Totals:
- Total members (linked)
- Active members
- Premium members
- Creators (linked)
- Playlists count
- Comments count
Column 4: Errors & Alerts
Errors and Warnings Panel (Red):
- Videos with processing errors
- Pending videos requiring review
- Galleries with bad scans
- Galleries with 404 errors
- User reports to review
Alerts Panel (Orange):
- Failed login attempts (last 24h)
- New comments to review
- New video uploads
- New gallery submissions
Features & Functions
Collapsible Sections
The Analytics section can be collapsed/expanded:
- Click the section header bar
- The
+/-toggle indicates collapsed/expanded state - State is saved in localStorage (persists across page loads)
Collapse sections you don't need to see often. Your preferences are remembered automatically.
Quick Action Dropdowns
Dropdown menus provide access to related pages:
- Click the dropdown button (has caret icon)
- Menu appears with sub-options
- Click outside to close
- Only one dropdown can be open at a time
Real-time Statistics
The dashboard calculates statistics in real-time from database queries:
Error Detection
The dashboard automatically detects and displays issues:
Database Health Check
The dashboard performs automatic database health monitoring:
To check database health via AJAX:
- URL:
main.php?dbaction=health - Response: JSON with size, table count, status, issues
Step-by-Step Usage
Understanding Your Dashboard
- Check the Welcome Section
- Verify you're logged in as the correct user
- Note your last login time and IP for security
- Review Errors & Alerts First
- Red panel shows critical issues requiring attention
- Orange panel shows informational alerts
- Click linked items to navigate to the relevant page
- Monitor Content Statistics
- Check pending content queue size
- Monitor processing pipeline status
- Review submission trends by date
- Track Traffic Trends
- Compare today vs weekly views
- Monitor click-through rates
- Watch member growth
Acting on Alerts
For Pending Videos:
- Note the count in the Errors panel
- Click the link to go to
video.admin.php?filter=pending - Review and approve/reject videos
For Error Videos:
- Click the error count link
- Check video processor logs for issues
- Retry processing or delete failed videos
For User Reports:
- Click the reports link
- Review reported content
- Take action (approve, remove, warn user)
For Failed Logins:
- Click the alerts link to view logs
- Check for suspicious IP patterns
- Consider IP blocking if needed
Using Quick Actions
- Navigate to Content:
- Click Videos, Galleries, Cams, or Creators buttons
- Each goes directly to the management page
- Access Reports:
- Click Reports dropdown
- Select Financial, Clicks, Tokens, or Content
- Configure Settings:
- Click Settings dropdown
- Select Videos, General, Cams, or Creators
Troubleshooting
Common Issues
Statistics Not Loading
Problem: Dashboard shows errors or blank sections.
Solutions:
- Check database connection:
// Test in a separate file

   $conn = mysqliconnect($dbhost, $dbuser, $dbpasswd, $db);

   if (!$conn) {

       echo mysqliconnecterror();

   }
- Verify tables exist:
SHOW TABLES LIKE 'tblVideos';
   SHOW TABLES LIKE 'tblTgp';
SHOW TABLES LIKE 'tblCMSUsers';- Check PHP error log:
tail -100 /path/to/ct/logs/php-error.logSlow Dashboard Loading
Problem: Dashboard takes too long to load.
Solutions:
- Add indexes to frequently queried columns:
ALTER TABLE tblVideos ADD INDEX idxstatus (status);

   ALTER TABLE tblTgp ADD INDEX idxaccept (accept);

   ALTER TABLE tblVideoViews ADD INDEX idxviewedat (viewedat);
- Optimize large tables:
OPTIMIZE TABLE tblVideos;
OPTIMIZE TABLE tblTgp;- Consider archiving old data if tables are very large
Alerts Not Showing
Problem: Expected alerts don't appear.
Check:
- Verify table contains expected data
- Check date/time queries match your timezone
- Ensure
tblLogsis being written to
Related Pages
- Login Page (
ct/admin/ctlogin.php) - Authentication gateway - Video Management (
ct/admin/video.admin.php) - Manage videos - Gallery Review (
ct/admin/admin.php) - Review galleries - User Management (
ct/admin/users.admin.php) - Manage members - System Logs (
ct/admin/logs.php) - View all logs - Settings (
ct/admin/config.setup.php) - Site configuration
Translatable Strings
The following text strings appear in this page and should be added to backend_translations.md:
Welcome Section
- "Welcome,"
- "Your last login was on"
- "from"
- "license"
- "Standard"
Quick Actions
- "Videos"
- "Cams"
- "Creators"
- "Galleries"
- "Reports"
- "Settings"
- "Financial"
- "Clicks"
- "Tokens"
- "Content"
- "General"
Section Headers
- "Analytics"
Table Captions
- "Videos / Galleries / Posts"
- "Scheduled (Next 30 Days)"
- "Content"
- "Categorization"
- "Traffic (Views)"
- "Members Area Totals"
Table Headers & Labels
- "Date"
- "Videos"
- "Galleries"
- "Posts"
- "Active videos"
- "Pending videos"
- "Processing videos"
- "Active galleries"
- "Pending galleries"
- "Active models"
- "Categories"
- "Tags"
- "Sponsors"
- "Today"
- "Last 7 days"
- "Total views"
- "Total clicks"
- "Total members"
- "Active members"
- "Premium members"
- "Creators"
- "Playlists"
- "Comments"
Panel Headers
- "Errors and warnings"
- "Alerts"
- "No errors or warnings"
- "No alerts at this time"
- "No recent submissions"
- "No scheduled content"
Alert Categories
- "Admin panel alerts"
- "Content added / modified by users"
Alert Messages
- "There are X videos pending review."
- "There are X videos with processing errors."
- "There are X galleries pending review."
- "There are X galleries with bad scans."
- "There are X galleries with frequent 404 errors."
- "There are X user reports to review."
- "There are X failed login attempts in the last 24 hours."
- "There are X new comments to review."
- "There are X new videos uploaded."
- "There are X new galleries submitted."
Database Health
- "Database:"
- "tables"