Admin Dashboard
What This Page Does
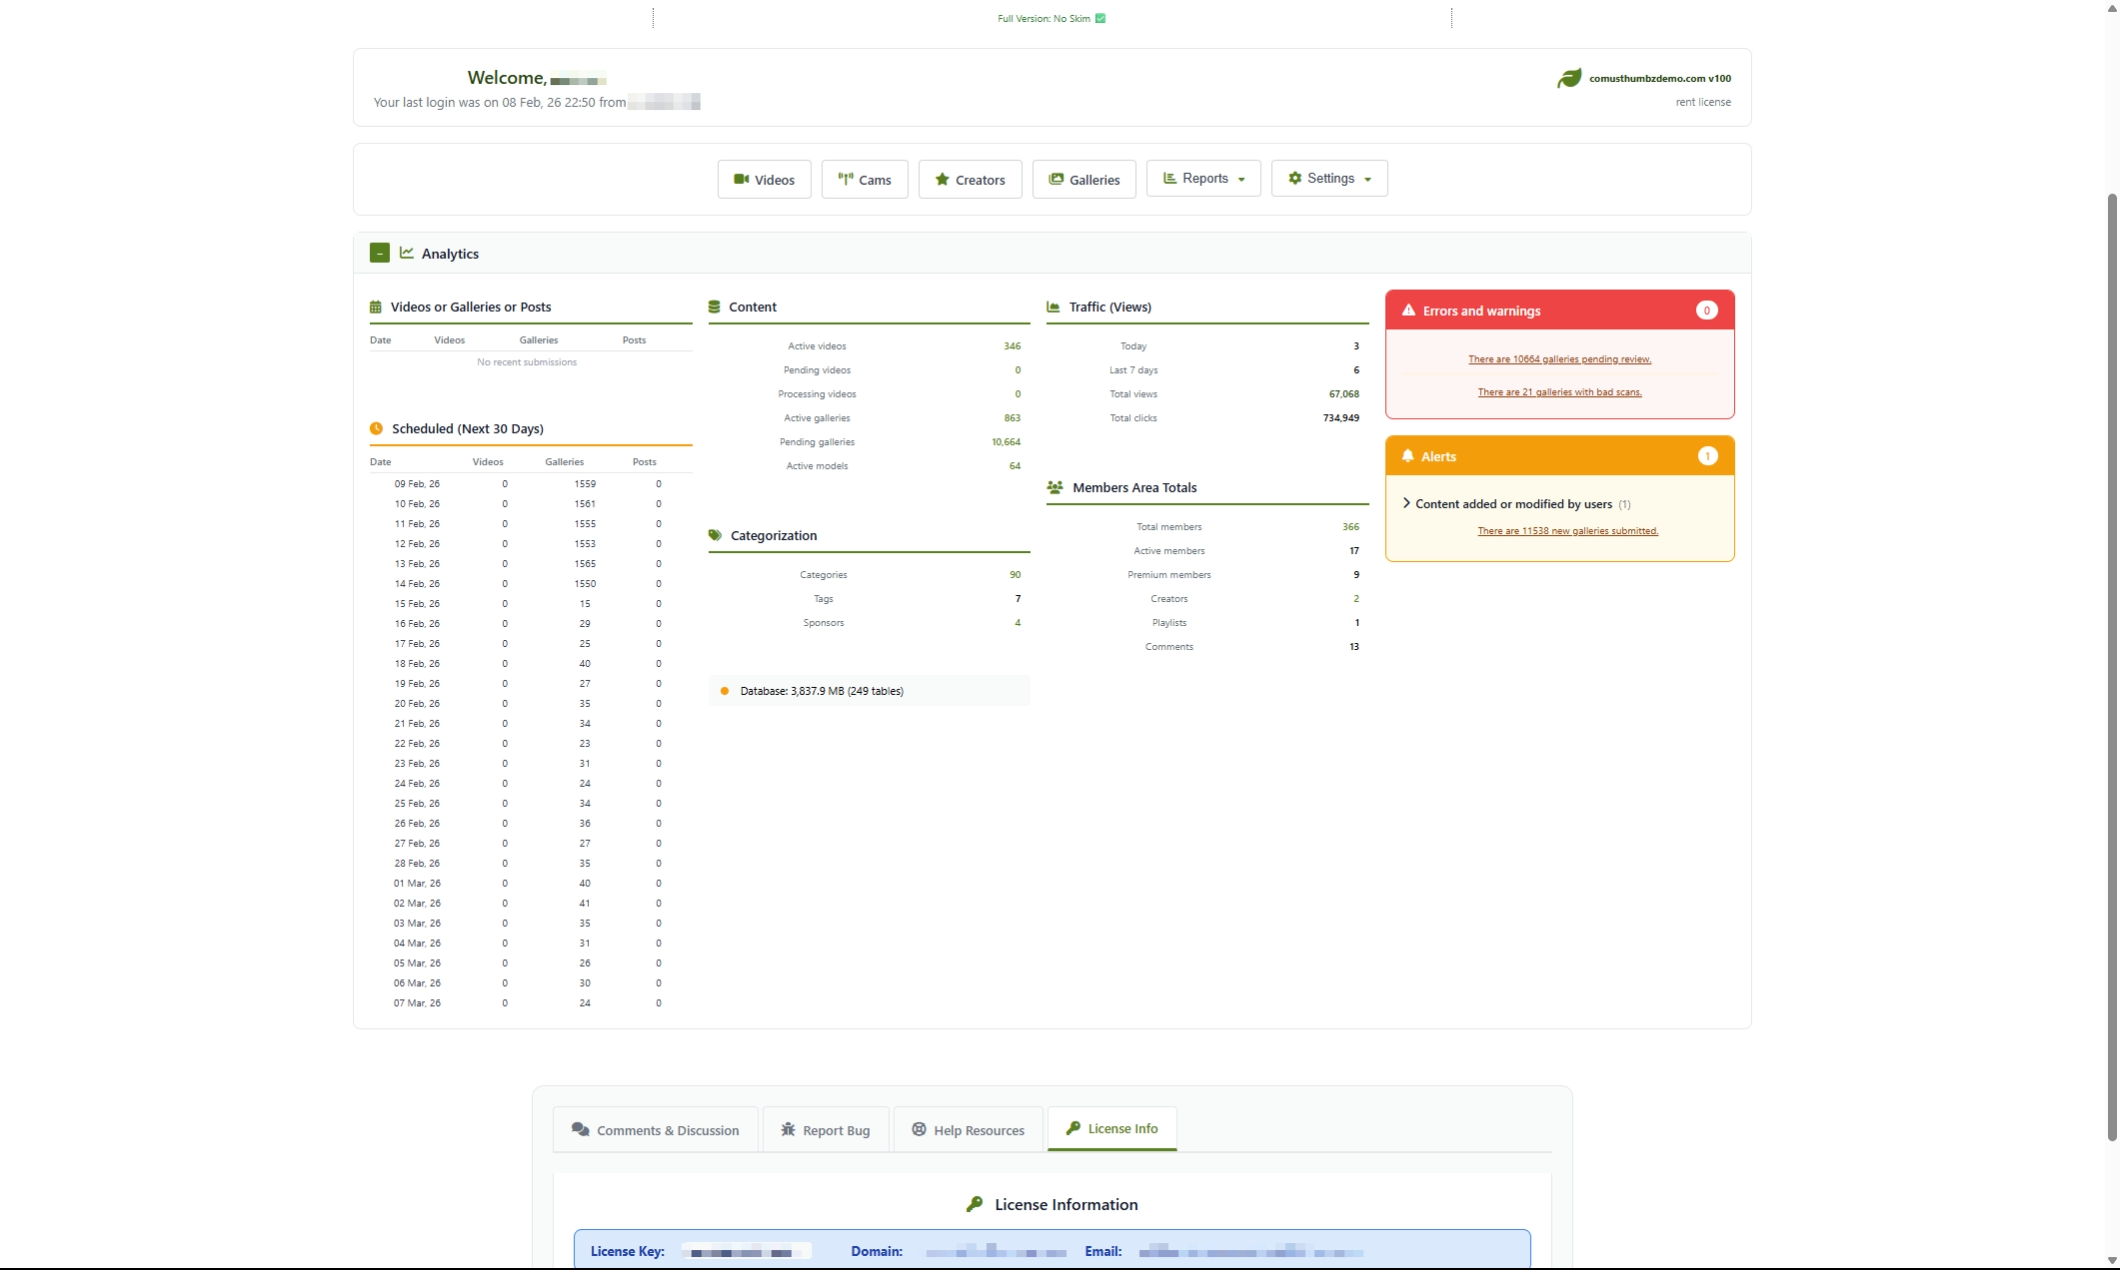
The Admin Dashboard is your home base. Every time you log in to the admin panel, this is the first page you see. It gives you a quick snapshot of everything happening on your site -- how much content you have, how many visitors you are getting, whether anything needs your attention, and shortcuts to the pages you use most often.
How to Get Here
Navigate to Admin Panel > Login
Understanding the Page
When you land on the dashboard, you will see several sections stacked from top to bottom. Here is what each one does.
Welcome Bar
At the very top, you will see a personalized greeting with your admin name, the date and time of your last login, your software version, and your license type. This is a good place to glance at for security -- if the last login time does not look familiar, someone else may have accessed your account.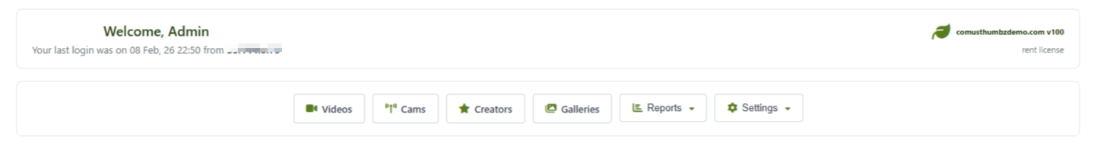
Quick Actions Bar
Below the welcome bar is a row of shortcut buttons that take you to the most commonly used pages: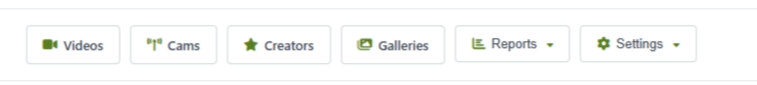
Analytics Section
This is the main body of the dashboard. It is organized into four columns of information. On smaller screens, these columns stack on top of each other automatically.
You can collapse this entire section by clicking the section header bar. A + or - sign shows whether the section is expanded or collapsed. Your preference is remembered, so it stays the way you left it next time you visit.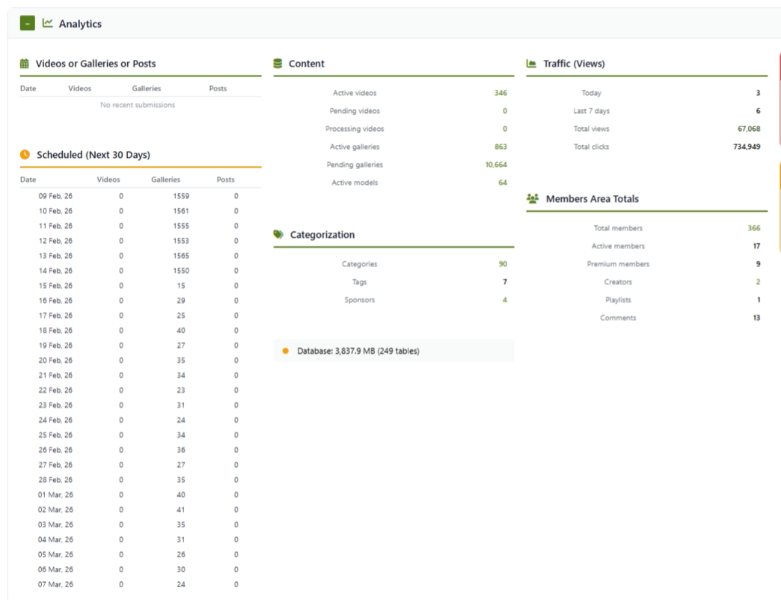
What the Analytics Columns Show
Column 1: Submissions by Date
This column shows a table of daily activity for the past 14 days. Each row is a date, and the columns show how many videos, galleries, and creator posts were added that day. Use this to spot trends -- are uploads increasing, decreasing, or steady?
Below the daily activity table, you will also see a Scheduled Content table. This shows any content that is set to go live within the next 30 days. If you have scheduled videos or galleries to publish on a future date, they will appear here.
Column 2: Content and Categorization
This column gives you a count of all the content on your site:
Below the content counts, you will see categorization numbers:
At the bottom of this column is a small Database Health indicator. A colored dot tells you the overall health of your database:
Column 3: Traffic and Members
This column shows how much activity your site is receiving and how your membership base looks.
Traffic numbers:
Member numbers:
Column 4: Errors and Alerts
This is the most important column to check every time you visit the dashboard. It is split into two panels.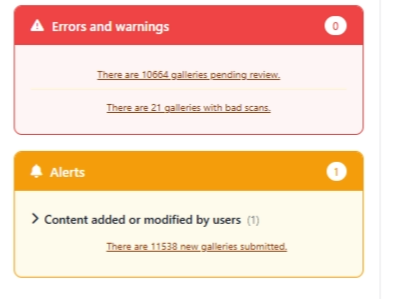
Errors and Warnings (red panel):
This panel highlights problems that may need your immediate attention:
- Videos with processing errors
- Videos waiting for your review
- Galleries with scan problems
- Galleries returning broken links (404 errors)
- Content reports submitted by users
Alerts (orange panel):
This panel shows recent activity that you should be aware of:
- Failed login attempts in the last 24 hours
- New comments waiting for review
- New videos uploaded recently
- New galleries submitted recently
Common Tasks
How to Check If Your Site Is Running Smoothly
- Log in to the admin panel. The dashboard loads automatically.
- Look at the Errors and Warnings panel (red) in the right column.
- If it says "No errors or warnings," your site has no critical issues.
- Check the Alerts panel (orange) below it for any recent activity.
- Glance at the Traffic numbers to confirm visitors are still coming to your site.
How to Review Pending Content
When the dashboard shows pending videos or galleries:
- Note the number of pending items shown in the Errors and Warnings panel.
- Click the linked text to go directly to the content management page, filtered to show only pending items.
- Review each item and approve or reject it.
- Return to the dashboard to confirm the count has decreased.
How to Handle Processing Errors
When videos show processing errors:
- Click the error count link in the Errors and Warnings panel.
- You will be taken to the video management page filtered to show problem videos.
- Check if the video file was uploaded correctly.
- Try reprocessing the video by clicking the retry option.
- If the error persists, the video file may be corrupted or in an unsupported format. Try uploading it again.
How to Investigate Failed Login Attempts
If the Alerts panel shows failed login attempts:
- Click the failed logins link to view the login log.
- Look for patterns -- are the attempts coming from the same location?
- If you see repeated attempts from an unfamiliar source, consider blocking that address.
- If the failed attempts are your own, double-check your password.
How to Use the Quick Actions
- Click any button in the Quick Actions bar to jump to that management page.
- For Reports or Settings, click the button to open a dropdown menu.
- Select the specific report or settings page you want.
- Only one dropdown can be open at a time -- clicking a different one closes the first.
How to Collapse the Analytics Section
If you prefer a cleaner view or do not need to see the full analytics every time:
- Click the Analytics section header bar.
- The section collapses and shows a + icon.
- Click it again to expand.
- Your preference is saved automatically and remembered next time.
Tips for New Users
- Check your dashboard at least once a day. It is the fastest way to spot problems before your visitors do.
- Pay attention to the Errors panel first. Pending content and processing errors directly affect what your visitors can see.
- Watch your submission trends over time. A sudden drop in uploads could indicate an issue with your upload system.
- Use the Quick Actions bar instead of navigating through menus. It is faster and takes you exactly where you need to go.
- If your traffic numbers seem unusually low, check the Errors panel. Broken content can drive visitors away.
Troubleshooting
The dashboard shows all zeros for statistics
What you see: Every number on the dashboard reads 0, even though you know you have content on your site.
How to fix it:
- Try refreshing the page in your browser.
- Log out and log back in.
- If the numbers are still all zeros, there may be a database connection issue. Contact your hosting provider or system administrator for help.
A section of the dashboard is blank or missing
What you see: Part of the dashboard does not load or appears empty.
How to fix it:
- Refresh the page.
- Try a different web browser to rule out a browser-specific issue.
- Clear your browser cache and reload.
- If the problem persists, contact support.
The dashboard loads very slowly
What you see: The page takes a long time to appear after logging in.
How to fix it:
- This can happen on sites with very large amounts of content. The dashboard needs to count all your videos, galleries, and members each time it loads.
- If loading times are consistently slow, contact your hosting provider to discuss database optimization.
I keep getting redirected to the login page
What you see: You try to access the dashboard but keep being sent back to the login screen.
How to fix it:
- Make sure you are entering the correct username and password.
- Check that your browser accepts cookies (they are required to stay logged in).
- Try clearing your browser cookies and logging in again.
- If you are still locked out, your session may have expired. Simply log in again.
Expected alerts are not showing up
What you see: You uploaded content recently but the Alerts panel does not mention it.
How to fix it:
- Alerts only cover the last 24 hours. If your upload was more than a day ago, it will no longer appear.
- Refresh the page to ensure you are seeing the latest data.
- If recent activity is still missing, there may be a timezone mismatch between your server and your location. Contact your system administrator.
The database health indicator is yellow or red
What you see: The colored dot next to "Database" is yellow or red instead of green.
How to fix it:
- A yellow dot means your database is getting large. This is not an emergency but may slow things down over time.
- A red dot means there could be a database problem.
- In either case, contact your hosting provider or system administrator to review your database health and perform any needed maintenance.